Jasper Galton-Fenzi
Tracing an AI configuration tool
The project
Clear-Com makes intercom systems used in broadcast and live events. The team was building an AI feature that lets users set up a system by chatting, for example "create a channel called Stage Left", instead of clicking through settings. The AI does this by calling tools exposed through MCP.
The problem: when the AI did something wrong, nobody could see why. Which tool did it pick? With what inputs? How much did it cost?
What I built
- Added OpenTelemetry tracing to a TypeScript MCP server and to the AI client that calls it, and sent the traces to a self-hosted Langfuse stack running in Docker.
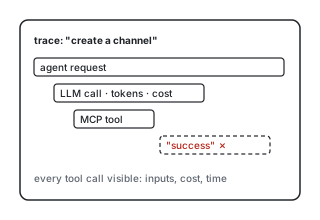
- The result: every request shows as one timeline, with the model call, its tokens and cost, and each tool call with its inputs and result.
- The device that runs the server is locked down and only reachable over SSH, so I set up a reverse SSH tunnel and scripts to get its traces out to the dashboard.
- Wrote a test plan to check that the AI path and the normal web path give the same result for the same action.
What I found
With every call visible, I found three places where the system reported success without actually doing the work, including a call that dropped entries but returned no error. I also caught an example config that would have sent configuration data to a third-party cloud.
What I learned
- "It said success" isn't proof. Check the actual state.
- Observability is what turns "the AI is acting weird" into a specific, fixable bug.
- Writing handover documents so the next intern can pick the work up.